Why Conference Attendance Graphics?
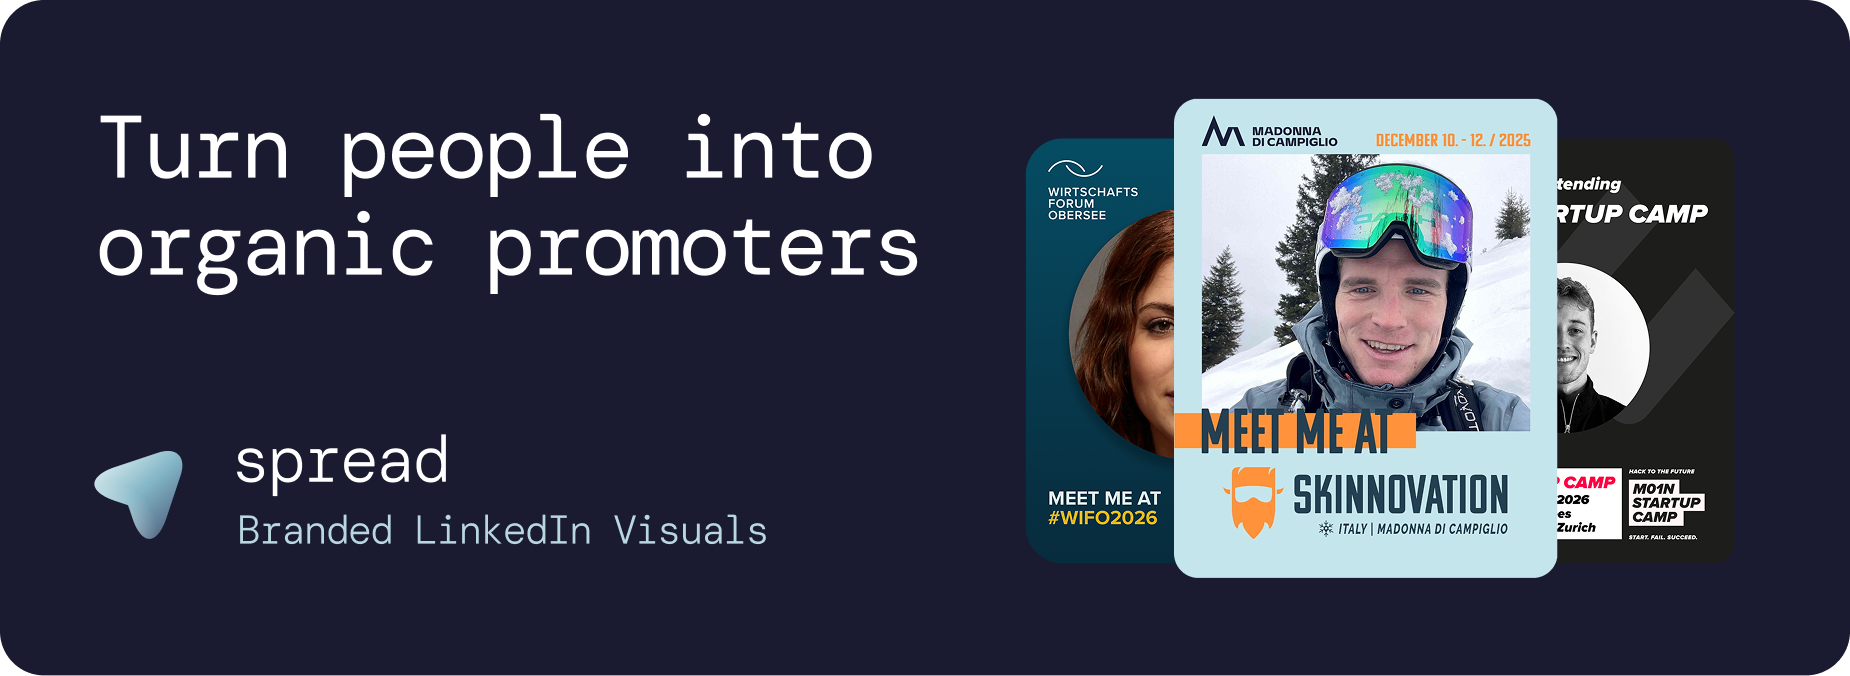
Conference attendance graphics are branded visuals that conference participants personalize with their professional photo and share on LinkedIn. They transform passive attendance into active promotion, turning every participant into an organic marketing channel for your conference.
The math is compelling: 100 shared conference attendance graphics generate approximately 250,000 impressions on LinkedIn. For large conferences with 500 or more attendees, this organic reach can exceed millions of impressions at zero advertising cost.
Why Conference Attendance Graphics Are the Highest-ROI Event Marketing Tool
Event marketers have many channels to choose from: LinkedIn ads, email campaigns, event listing sites, social media management. Conference attendance graphics consistently outperform all of them for three fundamental reasons:
1. Trust and Authenticity
Conference attendance graphics shared by a real professional carry the trust of personal endorsement. When your colleague announces they are attending a conference, you take notice. When a company page runs an ad, you scroll past. This trust gap is the primary driver behind the effectiveness of conference attendance graphics.
2. Algorithmic Amplification
LinkedIn gives personal content 3 to 5 times more organic distribution than company page content. Conference attendance graphics posted from personal profiles get this algorithmic boost automatically, dramatically extending their reach beyond the poster's direct connections.
3. Zero Marginal Cost
Once your conference attendance graphics are set up (which takes under 10 minutes with Go Spread), every additional share is free. There is no cost per impression, no budget cap, no diminishing returns. More shares simply mean more organic reach.
How Top Conferences Use Conference Attendance Graphics
Leading events have made conference attendance graphics a standard part of their marketing toolkit. Here is the proven phased approach:
Phase 1: Speaker Announcement Conference Attendance Graphics (6 Weeks Before)
As speakers are confirmed, send them dedicated speaker conference attendance graphics. Speakers have larger networks and higher authority, making their posts the highest-impact early promotions.
Phase 2: General Attendee Conference Attendance Graphics Launch (4 Weeks Before)
Include the conference attendance graphics creation link in pre-event emails and on the event website. This is when the majority of shares happen.
Phase 3: Topic Teaser Conference Attendance Graphics (2 Weeks Before)
Create topic-focused variants that highlight specific sessions, panels, or workshops. These conference attendance graphics drive interest in specific content tracks.
Phase 4: Countdown Conference Attendance Graphics (1 Week Before)
Urgency-driven messaging creates last-minute buzz and captures attendees who missed earlier communications.
Phase 5: Live Event Conference Attendance Graphics
On-site photo conference attendance graphics create real-time sharing that generates FOMO among non-attendees and drives interest in future events.
Phase 6: Post-Event Recap Conference Attendance Graphics
"I was at [Conference]" graphics with key takeaways extend the event's impact for weeks after it ends.
Role Differentiation in Conference Attendance Graphics
Creating separate conference attendance graphics for different participant types significantly increases adoption rates:
Attendee Conference Attendance Graphics
Standard "I'm attending" design with clean event branding and the attendee's headshot. The most widely used variant.
Speaker Conference Attendance Graphics
"Speaker" badge with talk title. Speakers share more readily when their specific role is highlighted. These conference attendance graphics generate the highest per-post reach.
Sponsor Conference Attendance Graphics
Sponsor logo integration provides measurable LinkedIn exposure. These conference attendance graphics are a tangible sponsorship deliverable with trackable analytics.
VIP Conference Attendance Graphics
Premium design treatment for VIP ticket holders. The exclusivity drives sharing because VIPs want to signal their access level.
Mentor Conference Attendance Graphics
For conferences with mentorship programs. "Mentor" badges attract mentees who want to connect before the event.
First-Timer Conference Attendance Graphics
"First-Timer" badges create a welcoming signal for new attendees, encouraging experienced conference-goers to reach out.
Go Spread: The Platform for Conference Attendance Graphics
Go Spread powers conference attendance graphics for some of the most respected events in the industry: Skinnovation, WIFO, SICTIC Forum, Entra, the Operator Circle, ChefTreff, and Global Talent Summit.
Complete Feature Set for Conference Attendance Graphics
Visual template builder: Create conference attendance graphics templates in minutes with drag-and-drop
Auto branding: Extract logo, colors, and event details from your conference website
Brand-locked templates: Every conference attendance graphic stays perfectly on-brand
Role badges: Attendee, Speaker, Sponsor, VIP, Mentor, and custom designations
Pre-written captions: LinkedIn captions with networking hooks, one-click copy
No account needed: Participants create conference attendance graphics without sign-up
Analytics dashboard: Downloads, template performance, trends, estimated impressions
Mobile-first: Optimized for any device
LinkedIn-optimized: 1080x1350px (4:5 ratio) for maximum feed visibility
LinkedIn direct posting: Share conference attendance graphics directly to LinkedIn
Conference Attendance Graphics vs. Paid LinkedIn Campaigns
Factor | Conference Attendance Graphics | Paid LinkedIn Ads |
|---|---|---|
Cost per 1,000 impressions | €0 (organic) | €5 to €15 |
Trust level | High (personal endorsement) | Low (sponsored content) |
Engagement rate | 3 to 5x higher | Baseline |
Social proof | Built-in (real people sharing) | None |
Audience targeting | Natural (professional networks) | Algorithmic (can miss) |
Content longevity | Stays on profiles permanently | Disappears when budget ends |
Scalability | Every additional share is free | Every additional impression costs money |
Use Cases for Conference Attendance Graphics
Multi-Day Industry Conferences
Create conference attendance graphics spanning the full event or separate variants per day. Multi-day events benefit from sustained sharing across the entire conference period.
Industry Forums and Roundtables
Conference attendance graphics position participants as industry insiders. The exclusive nature of forums and roundtables makes these graphics especially shareable.
Academic Conferences
Researchers, professors, and PhD students share conference attendance graphics to build academic visibility and demonstrate engagement with their field.
Corporate Leadership Summits
Leadership team conference attendance graphics double as employer branding on LinkedIn. Executive shares reach extensive professional networks.
Startup Demo Days and Pitch Events
Founders use conference attendance graphics to signal credibility and attract investor attention. "I'm pitching at [Event]" graphics create buzz in the startup ecosystem.
Trade Shows and Expos
Both exhibitors and visitors share conference attendance graphics to announce their presence and invite meetings, driving more productive conversations on the show floor.
Design Best Practices for Conference Attendance Graphics
Photo prominence: Attendee's headshot should dominate (40 to 50% of the graphic)
Role badge: Clear, visually distinct designation
Event branding: Logo, name, date, location
Format: 1080x1350px (4:5 ratio) for LinkedIn
Colors: Bold, contrasting colors against LinkedIn's white feed
Text: Minimal. Let the photo and branding do the work
Measuring Conference Attendance Graphics Impact
Go Spread provides comprehensive analytics for conference attendance graphics:
Total and unique downloads
Template performance comparison
Daily creation trends
Conversion funnel (visitors to downloaders)
Estimated LinkedIn impressions
This data is invaluable for proving value to sponsors, management, and stakeholders. It also helps optimize future conference attendance graphics campaigns.
Get Started with Conference Attendance Graphics
Create conference attendance graphics at go-spread.com. Free tier available for smaller events, no credit card required.
For larger conferences, contact Go Spread to find the most fitting plan for your conference attendance graphics strategy.